Data visualization is cool and I’ve been thinking about better ways to visualize backscattered electron images of meteorite thin sections. Scanning electron microscopes can acquire these images with sixteen bits of intensity information (pixels have values between 0 and 65,535), but for display we’re pretty much stuck with eight bits (0-255). So we’re throwing away a lot of information and possibly missing some subtle variations of contrast by converting to 8-bit grayscale. One solution is to map the 16 bits of grayscale values to 24 bits of color values. This will give us more unique color values. But how should we do this mapping? That is the question!
Below is the same backscattered electron image for six different color maps: (from left to right): gray (256 unique 8-bit color values — of course!), inferno (904 unique 8-bit color values), magma (778), parula (963), viridis (688), plasma (686).

I think my favorite is the third from the left: magma. I prefer mapping black to black for the zero value, but maybe I am too stodgy. Unfortunately magma has fewer unique 16-bit -> 8-bit color values than inferno and parula. However inferno most easily allows one to distinguish iron sulfide from iron metal which is important and certainly difficult to do in the grayscale image. (Another idea is to use grayscale mapping but have a dynamic black point, white point, and gamma.)
Bonus: can you find the SIMS spot?
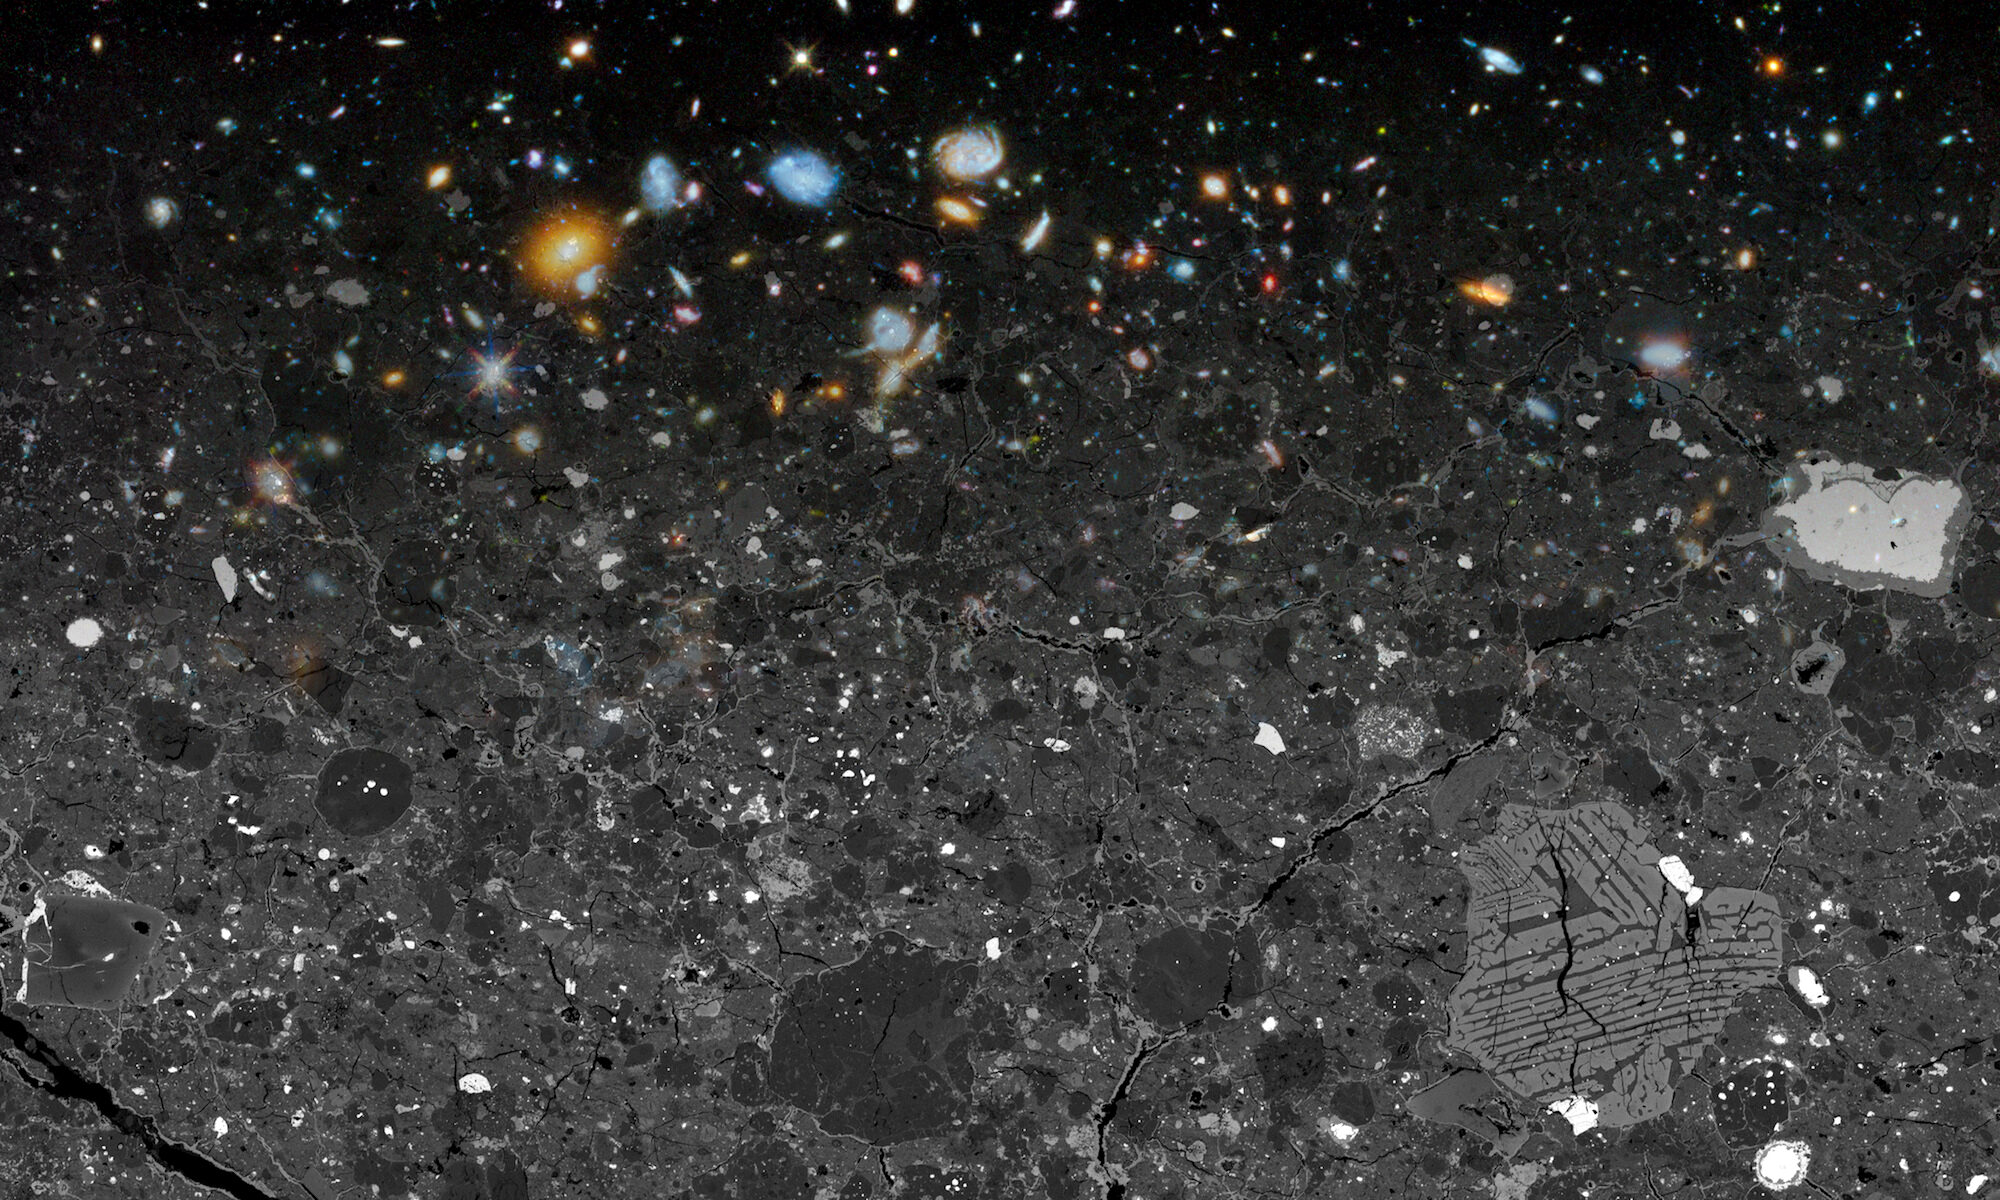
This is my favorite meteorite Acfer 094.
2
3
4
5
6
7
8
9
10
11
12
13
14
15
16
17
18
19
20
21
22
23
24
25
26
27
28
29
30
31
32
33
34
close all
% Color maps from:
% https://www.mathworks.com/matlabcentral/fileexchange/51986-perceptually-uniform-colormaps
A=imread('~/Downloads/Acfer-TEMP/070_020.png');
pxx=size(A,1);
pxy=size(A,2);
pp1=gray(2^16);
pp2=inferno(2^16);
pp3=magma(2^16);
pp4=parula(2^16);
pp5=viridis(2^16);
pp6=plasma(2^16);
A1=uint8(reshape(255*pp1(A+1,:),pxx,pxy,3));
A2=uint8(reshape(255*pp2(A+1,:),pxx,pxy,3));
A3=uint8(reshape(255*pp3(A+1,:),pxx,pxy,3));
A4=uint8(reshape(255*pp4(A+1,:),pxx,pxy,3));
A5=uint8(reshape(255*pp5(A+1,:),pxx,pxy,3));
A6=uint8(reshape(255*pp6(A+1,:),pxx,pxy,3));
image([A1 A2 A3 A4 A5 A6])
axis image
axis off
imwrite([A1 A2 A3 A4 A5 A6],'colormap_16bit_test.png');
fprintf('Unique colors in gray: %d\n',size(unique(uint8(round(255*pp1)),'rows'),1))
fprintf('Unique colors in inferno: %d\n',size(unique(uint8(round(255*pp2)),'rows'),1))
fprintf('Unique colors in magma: %d\n',size(unique(uint8(round(255*pp3)),'rows'),1))
fprintf('Unique colors in parula: %d\n',size(unique(uint8(round(255*pp4)),'rows'),1))
fprintf('Unique colors in viridis: %d\n',size(unique(uint8(round(255*pp5)),'rows'),1))
fprintf('Unique colors in plasma: %d\n',size(unique(uint8(round(255*pp6)),'rows'),1))
